This Little-Known Indicator Can Help Traders Stay One Step Ahead…
In November 2006, Christopher Hendrix (CMT) introduced the Momentum of Comparative Strength (MoCS) indicator in an issue of Stocks, Futures & Options Magazine.
Changes in the direction of momentum often precede price trend changes. This indicator aims to refine relative strength (or RS, an indicator we’ve covered before) as a momentum tool and help traders identify changes in the trend of a stock.
What Is MoCS?
MACD is one of the most popular technical indicators. It calculates the momentum of the price by taking the difference between a short-term and long-term moving average (MA) of the closing prices.
MoCS replaces price with RS in the standard Moving Average Convergence/Divergence (MACD) formula.
The formula for MoCS is: MoCS = [12-period EMA of (Tradable/Market Index)] – [26-period EMA (Tradable/Market Index)]
Where:
— EMA is an exponential moving average
— Tradable is the closing price of the stock, ETF, mutual fund or derivative being traded
— Market Index is the closing price of a broad market index, like the S&P 500 index (it could be the Barclays Capital Aggregate Bond Index if you are trading bond ETFs or the CRB Index for a group of futures-based ETFs).
The values shown are the default values for MACD and work well in MoCS calculations. However, simple moving averages could be used instead of EMAs and individual traders can use any time period they choose. This indicator can be used with daily, weekly, monthly or intraday charts.
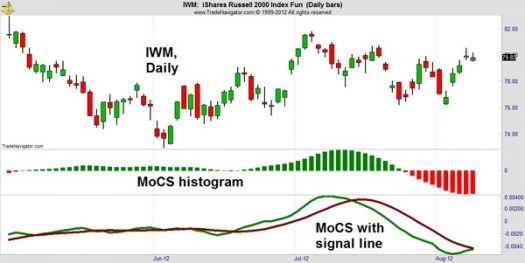
You can apply both MACD and MoCS with the addition of a signal line, usually a 9-period EMA of the indicator, to generate trading signals. When MoCS crosses above the signal line, a buy signal is given. Sell signals are given when the MoCS indicator falls below the signal line.
How Traders Use The MoCS Indicator
Traders use MoCS as a fully defined trading system or as one input in deciding whether to buy or sell.
The indicator is shown below on a historical daily chart of iShares Russell 2000 Index (NYSE: IWM). The histogram in the middle of the chart uses the formula shown above with the S&P 500 used as the market index. In the bottom of the chart, the 9-day signal line (dark red line) is applied to the MoCS.

Backtesting has shown that this indicator can be profitable on both long and short trades when used as a histogram or with a signal line.
MoCS can also confirm RS signals. RS is often shown as a percentile value ranging from 1 to 100. Traders can buy when RS crosses above 80 and sell when RS falls back under 80. They could also add MoCS as a confirming indicator and only take buy signals when MoCS is positive, a strategy that could help avoid losing trades.
Why The MoCS Indicator Matters To Traders
By combining momentum and relative strength, MoCS relies on two time-tested and reliable concepts. MoCS offers very clear and testable trading signals.
An advantage of MoCS over other RS methods is that it can easily be applied to any security and adapted to whatever market a trader prefers. Traditional RS measures are applied to the broad stock market while MoCS can be calculated with bond or commodity indexes. It requires less data than traditional RS ranking systems and is simpler to calculate than traditional RS measures.
MoCS also incorporates momentum, which could be an advantage over RS. Many traders find that price-based momentum indicators turn before changes in the price trend occur. RS has a tendency to lag price movements and MoCS can provide signals before RS changes direction. For example, this indicator can help traders avoid stocks that suffer big drops on earnings misses. This is because momentum often slows in these stocks ahead of the earnings announcement.
MoCS shows the value of applying indicator analysis to RS. A similar approach, substituting RS for price, can be taken with any indicator formula. Traders seeking an edge may find this to be a profitable way to stay ahead of the market.
P.S. Our colleague Robert Rapier is showing traders how to print cash “on command” every time they trade, for up to $668 in weekly income…
By using one of the simplest strategies around, Robert and his followers are earning three times as much as they would with normal dividends (sometimes even 20x).
And for a limited time, he’s pulling back the curtain to show everyone how it works. Get the details here now.
