An Important History Lesson For Investors During This Tough Market…
Investors who grew up in the 1990s can probably relate to the theme song of the popular sitcom Friends right now:
“…when it hasn’t been your day, your week, your month, or even your year.”
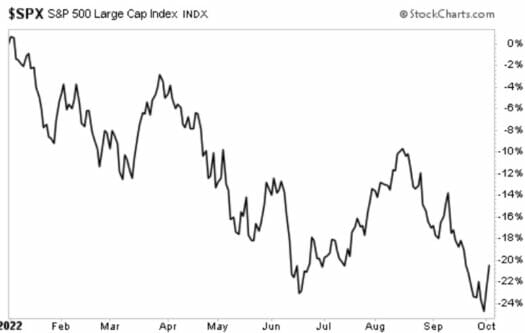
We just slogged through a miserable week, which ended a terrible month, and closed out an awful quarter in what has been a brutal year.
Historically speaking, September has been the coldest month on the calendar for stockholders. My team came up with this chart, which we shared with my premium readers, showing data for the past 20 years. But sources such as the Stock Trader’s Almanac report similar findings over even a longer period.

Source: Stockcharts.com
This past one was unusually bad, with the S&P 500 sliding almost 10%. The closely-watched benchmark is now down nearly 20% for the year (and it would have been 25% if not for two rare bullish days in a row to start this week). Having suffered three straight negative quarters, this is the longest such losing streak since 2008.

Add that one to the long list of the “worst this” since 2008 or the “steepest that” since 2008. It has become the baseline yardstick for everything unsettling in the economy right now, from mortgage rates to GDP. Of course, any comparison to 2008 is usually bad news.
That’s like a struggling baseball team being compared to the inept 1962 Mets (which famously lost 120 games). In the macroeconomic world, 2008 was about as ugly as it gets.
Déjà Vu, All Over Again…
A brief recap is probably in order. The short, short version is that subprime mortgages imploded, causing cascading failures in the financial system. Securities backed by pools of home mortgages lost trillions, leading to massive asset write-downs that eroded the balance sheets of banks and brokerages, bringing many to the brink of collapse. Tangled credit default swaps just added fuel to the fire.
Lax mortgage lenders, overreaching homeowners, reckless investment bankers, leveraged hedge funds, and even complacent ratings agencies all shared in the blame. In the end, it took unprecedented bailout packages to narrowly avert disaster. Remember TARP? The Troubled Asset Relief Program gave financial institutions a mechanism to unload toxic subprime debt, thawing the frozen credit markets from a state of paralysis.
Bankruptcies and foreclosures were rampant that year, and the housing market crash ushered in a deep recession that spilled over into the stock market, triggering a punishing downturn.
Of course, the circumstances are completely different today. But the constant drumbeat of bad news and dizzying market volatility feels eerily similar. That’s one of the reasons financial writers like to compare today’s bear market to the preceding one – not just to provide perspective but also reassurance. We’ve survived dark times before and always emerged stronger.
Out of curiosity, I just revisited the September 2008 Street Authority archives to see what I told my readers back then. Here is a short excerpt.
This rescue package should help restore both confidence and sanity on Wall Street. It will also remove a great deal of uncertainty, allowing investors to focus their attention elsewhere. And when they do, I think most will realize that there are highly undervalued and attractive stocks all around us.
The good news is that interbank lending rates are coming down — a good sign that money is finally moving around. That’s why the headlines are now shifting towards more mundane topics like oil prices and third-quarter earnings. And with traders keying on plain old earnings instead of the worst financial crisis of the century, you know we’ve taken a big first step towards a return to normalcy.
We couldn’t yet see the light at the end of the tunnel at that point. But I concluded by making comparisons to the 2002 market selloff, reminding readers that that particular downturn eventually gave way to a 30% bounce in the market over the next 12 months.

Closing Thoughts
In case you’re curious, that’s also around the time we first introduced Realty Income (NYSE: O) to our readers. As I explained in this article, it would go on to become one of our all-time best performers. I also singled out Expedia (Nasdaq: EXPE), which had been left for dead, trading at just $13 and change. The stock has since topped the $200 mark before being cut in half over the past six months.
For the record, the rebound from the 2008 crash was even swifter than the recovery in 2002. After hitting bottom the following March, the S&P vaulted 60% over the next 12 months, starting a new bull phase that would last for a decade (until Covid struck).
My point is the market is cyclical. So at some time (perhaps 2030?), we will encounter another prolonged selloff similar to what we are enduring today. And when that happens, I’ll remind future readers about the inflation-ravaged 2022 economy that battered both stocks and bonds… until the recovery took hold. And how we opportunistically scooped up some wonderful names that were trading at discounted prices, which then went on to make a killing for us.
But let’s not get ahead of ourselves just yet. We’ve got a tough earnings season on the horizon, with many multinational companies fighting against foreign currency headwinds from the surging U.S. dollar. Expect to hear much more on that particular topic in the coming weeks.
In the meantime, if you’re looking for high-income opportunities in this market but don’t know where to start, then you’re in luck…
In my latest report, you’ll find 5 “bulletproof” high-yield stocks that you can own for the long-term — picks that are so solid, they’ve weathered every dip and crash over the last 20 years and still handed out massive gains.
