8 Weeks In A Row… What’s Next For The Market Rally?
There’s an old saying that trees don’t grow to the sky. In other words, there is a natural limit to growth. In the case of a tree, maybe the tree’s structure makes it impossible for nutrients to reach above a certain height.
As with so many sayings, this one is often applied to the stock market. For example, companies cannot continue growing earnings at 100% per year forever. There is a natural limit to a company’s growth. The same is true for stock prices.
I think of this old saying whenever I see a long streak of up or down closes. In the chart below, you can see that the S&P 500 has closed higher for eight weeks in a row.

This is not unprecedented. There have been 30 previous instances when a streak lasted at least eight weeks. The longest winning streak on record is only 12 weeks.
So, we know the current streak will end. But what does history tell us about this scenario? When is it likely to end? And what happens after that? To help answer that question, I ran some tests to see what’s happened in the past. The results are summarized in the table below.
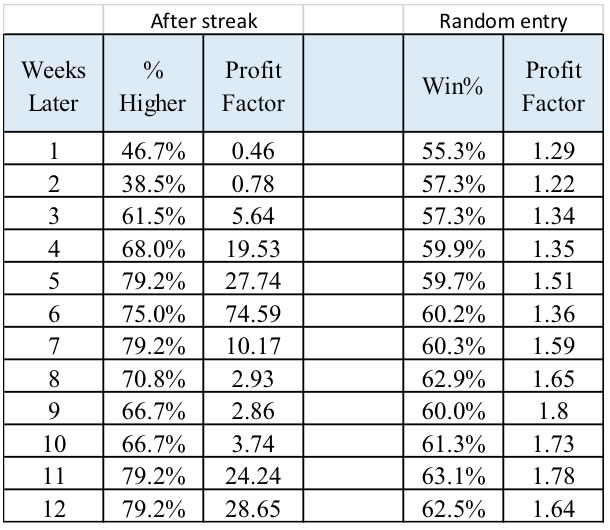
The “After streak” section of the table shows how the S&P 500 fared X weeks after an eight-week winning streak. For example, in the second week after the streak, the index was higher just 38.5% of the time.
“Profit Factor” is the ratio of profits to losses for the trading rule. A ratio greater than 1 indicates the rule should be profitable. Traders generally look for factors above 2; above 3 is considered outstanding by many traders.
Conclusions
The table shows the next two weeks have a strong downward bias. A trader could consider buying put options which increase in value when prices fall. But after that, there is a strong upward bias in the index. The strength of that bias can be seen when comparing the data to the two columns on the right side of the chart.
Those two columns show what is expected after a random entry. In general, stocks have an upward bias and this is seen in the data where win rates are above 50%, indicating prices close up more often than down no matter how long the holding period is. The Profit Factor also reflects the upward bias.
In short, this data tells us that the past eight weeks have most likely set up a strong bullish move in the S&P 500. If history is a guide, we could see a brief pullback and then a strong rally.
How I’m Trading Right Now
Now, feel free to put as much stock in all of this data as you want. But I’ll tell you what I’m recommending to my Income Trader readers…
We’re playing it extra cautious right now by returning to winning trades we’ve made in the past. In my most recent issue, I told readers to sell another put option on discount retailer Five Below (Nasdaq: FIVE) — right after we closed out a previous winning trade. But that’s the beauty of our strategy… Unlike most investors, my Income Trader readers know that trading options doesn’t have to be risky or complicated. If you’d like to learn how to do this, go here.