This Proven Tool Is Telling Me The Bull Market Isn’t Over
After taking a quick hiatus from the bullish trend that ended in September 2018 — and the near 20% plunge in December — the market, as measured by the S&P 500, has resumed its upward course. The index took out its late September 2018 highs this past Friday, April 26. Since then, it has gone on to hit record heights.
To be sure, as the market hits new highs, there will always be the crowd of folks shouting that “this” is the top. Of course, nobody knows what the market will do tomorrow, the next day, next week or a month from now. But for us, we can lean on some technical indicators that will help tell us if this is a strong market rally or simply a head fake.
The main one that we will look at is the Advance-Decline (A-D) Line. I talked about this indicator in this article, where I warned that a bear market could be looming (a month later the S&P 500 bottomed, dropping 19% from its September high). I also touched on it in this article, showing it rebounding, a signal that near-term momentum was strong. The market has ripped off a double-digit return since then.
In short, the A-D Line has historically been a good indicator of market strength or weakness.
As a quick refresher, the A-D Line is a breadth indicator that tracks the cumulative sum of NYSE daily advancing stocks minus declining stocks and gauges how broadly the market is participating in this rally. If the market is hitting new highs, we want to make sure that this indicator is also hitting new highs, as that tells us there’s broad participation in the rally, which bodes well for further gains and sustainability in the near term.
And that’s exactly what we have today…
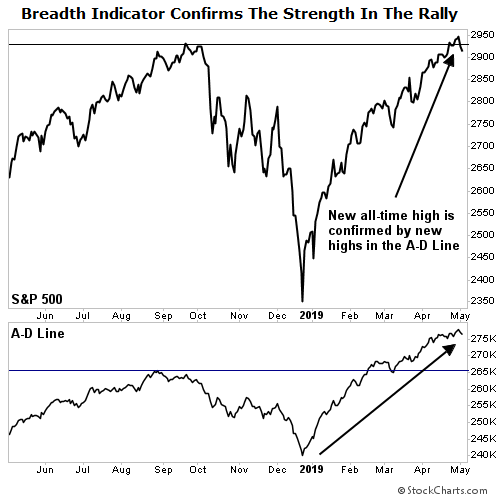
As you can see, the sharp rise in the A-D Line to new highs (ahead of the broader market’s new highs) provides the single most positive indication that this bull market is not yet over.
But not everything is rosy…
Treasuries Flash A Warning Signal
At the end of March, the yield curve for U.S. Treasuries inverted for the first time since 2006. In other words, 3-month T-bills yielded more than 10-year Treasury Bonds. Typically, the longer your money is tied up the better you’re compensated. That’s why, under normal circumstances, 10-year T-Bonds have higher yields than shorter-duration ones.
Why does this matter?
An inversion of yields for 10-year Treasury bonds and 3-month T-Bills is one of the most historically reliable precursors to an economic recession. As you can see in the chart below, each time the yield curve has inverted (the red arrows) it has preceded an economic recession (gray bars).
%20(1).png)
While this has historically been one of the best economic warning flags of a recession, the time between when the yield curve has inverted and the start of a recession isn’t consistent. The lead time has been anywhere from five to 16 months.
Keep in mind that an inversion of the yield curve does not cause a recession. It’s simply an indication that financial conditions have deteriorated, which carries serious implications for the U.S. economy. And the economy is not the stock market. Historically, the stock market peaks before a recession begins.
Action To Take
Over the next few months, I expect the market to continue reaching new heights, as indicated by our breadth indicator, the A-D Line. Over a longer time frame, I will remain cautious as the recent inversion of the yield curve is a classic warning flag. In the meantime, there’s still plenty of gains to be plucked from this bull market. And last week, my Maximum Profit system flagged three new buys. If you’re interested in learning more about the system and what we’re adding to the portfolio, simply go here.
P.S. Want to know the secret to making 18x more than buy-and-hold investors? Master trader Jim Fink has come up with a system that turns small stock movements into winners that are up to 18 times better than what a buy-and-hold investor would see. He’s sharing how this powerful tool works… and how you can use it to make $125,000 in the next year… at the Ultimate Profits Summit. It airs on May 9th at 1.pm. Spots are limited. Click here to register now.