Seasonal Bullish Signals Point To This 8-Time Winner
Stock markets remain volatile. While this can sometimes be good news, unfortunately for traders, there is no clear directional bias to the volatility.
| —Sponsored Link— |
| As Easy To Buy As Amazon Or Apple… And you can get into these stocks now. Before the next wave of money comes flooding into the market. One company posted 7,820% gains in just eight months! Another posted 6,233% gains in just four months! Click here to find out how… |
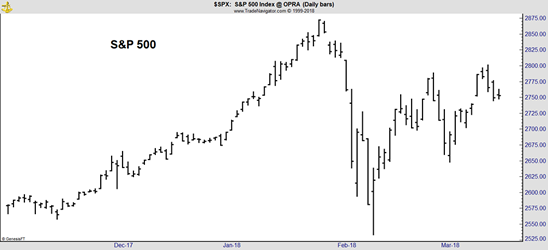
The chart below shows that prices are at the same level they were three weeks ago. But, to get nowhere, the S&P 500 index fell sharply, rallied sharply and then drifted lower.

This is a difficult market for positional traders who like clear trends. If the trend is up, they can simply buy and hold. If the trend is clearly down, traders can either hold cash or use strategies like selling futures contracts to benefit from the decline. In a trendless market, traders tend to suffer short-term losses no matter which strategy they use.
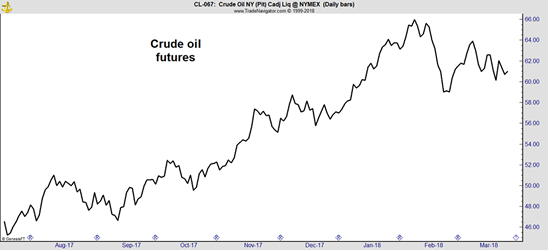
This can lead to frustration. Some traders will become so frustrated that they look to other markets. One market many hedge funds will consider is the crude oil market. Crude oil has been in an uptrend for almost a year, although prices pulled back recently.

Hedge fund traders often look at some less popular indicators to help them find trades — tools like seasonal trends.
#-ad_banner-#Many markets display a seasonal pattern, which means the product is in demand more at certain times of the year. For example, demand for gasoline increases in the summertime as more families drive for vacations. Futures markets reflect these tendencies.
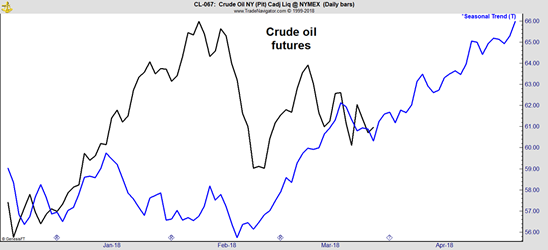
To have enough gasoline on hand for the summer driving season, refineries will need to produce gas before drivers hit the road. That means they will buy crude oil weeks before the driving season, which means we should see a seasonal uptrend in crude oil to reflect that buying. That’s exactly what we’re seeing right now, as illustrated in the chart below, which is showing a bullish seasonal pattern that reflects refineries stocking up on the raw material they need to provide gasoline for the summer driving season that begins in a few weeks.

The seasonal trend in that chart is calculated by averaging the changes in the difference in the logarithms of prices that occur over time. That’s a widely accepted standard for identifying seasonal trends in market prices. I won’t go into detail on the process, but I want you to understand there is a sound basis behind the indicator.
Now, while I strongly believe traders should never make a trade based solely on seasonals, this kind of analysis can certainly help identify trading opportunities. In this case, the seasonals confirm a trade I uncovered this week in Andeavor (NYSE: ANDV), an oil and gas refiner.
Same Company, New Name
I’ve written about this company several times, mostly back when it was known as Tesoro. (The company just changed its name last August.)
Andeavor has varied operations that have allowed the company to maintain profitability through the downturn in energy prices. The company owns and operates seven petroleum refineries with a combined crude oil capacity of approximately 895,000 barrels per day. ANDV also owns and operates a network of approximately 650 miles of crude oil and natural gas pipelines. The company also sells its products through a retail network. It operates 2,492 retail gas stations under the ARCO, Shell, Exxon, Mobil, USA Gasoline, Rebel, Thrifty, and Tesoro brands.
The last time I found a trade in the stock, I highlighted the strong correlation between the price of oil and the price of the stock (and we walked away with a 2.5% gain in just over a month, or 24.7% annualized). With oil’s chart being bullish, now is an ideal for a short-term trade in ANDV.
The stock remains undervalued, trading at 10.6 times this year’s expected earnings per share of $9.33. This is a discount to the average price-to-earnings (P/E) ratio of 12 that the stock has traded with over the past seven years.
The low valuation reflects the small profit margins the company delivers. Over the past seven years, the net profit margin averaged 2.8%. The average net profit margin for the companies in the S&P 500 index is 9.1%, more than three times higher than Andeavor’s.
The low margins explain the low average valuation, but the stock is trading at a bargain level right now with upside potential of about 20% and limited downside risk.
While investors could simply buy shares of Andeavor, I’ve found a better trade…
How I’m Trading This Stock — Without Buying A Single Share
This trade allows me to make a quick 3.1% income payout from the stock in 36 days — and ties up less trading capital than simply buying the stock. What’s more, I can repeat similar trades like this again and again, potentially making 31% on an annual basis.
It’s just part of what makes my trading strategy so unique.
While I can’t get into all the details about how it works right now, I can point you to a special report that tells you everything you need to know. You’ll learn how my readers are earning an average of $568 a week with this strategy — and how you can, too.
